Analyzing trends in Hollywood film over four decades using data scraped from Wikipedia.
Author
Andrew Carr
Published
November 1, 2019
In this post, I examine how Hollywood film has changed over the past few decades. I look at the changing relationship between genre and movie box office returns, shifts in the representation of men and women among top-billed actors, and the relationship between critical and commercial success. I conduct these analyses using data that I collected through Wikipedia’s APIs. The data consists of 9712 movies. The population frame is all movies with Wikipedia entries released in the United States between 1980 and 2019.
Film Data
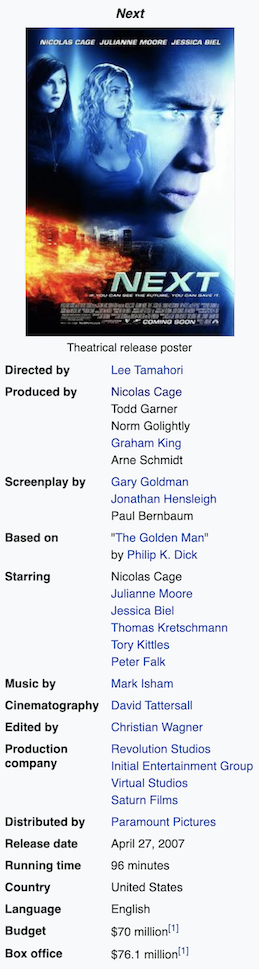
Wikipedia has a set of APIs that allows users to collect almost anything from the site. My data comes from a group of pages that have the headline “List of American films of [a year]”. Each of these pages has tables with movie titles and links to their pages. By drawing from these, I collected a list of names and links for 9712 movies and pulled information from the infobox of each movie page. Here’s what the infobox looks like for Next, a timeless cinematic masterpiece starring Nicolas Cage as a small-time magician who can see exactly two minutes into the future.
For each movie, I collected the release date, box office, budget, runtime, directors, and top-billed actors from the infobox. I also gathered links to the pages of top-billed actors in each movie. I collected additional information by examining main body of movie pages. Most movie pages have a “Critical Reception” section that has a movie’s Rotten Tomotoes score and the number of reviews on which this score is based. I also extracted movie genre from the introduction of each movie page. Finally, I used a set of rules for extracting where the film was set from the film synopsis. Let’s have a look at the columns of the data.
This dataset has movie name, director and director link, genre, runtime, budget and box office information, Rotten Tomatoes review information, and release date information. After that, there is a set of columns that are nested lists containing data on top-billed actors in each movie. These lists contain actors’ names, links to their Wikipedia pages, race, gender, age, birthday, and more. Finally, there are several columns of movie-level actor data, including the proportion Black of top-billed actors who are Black and the total number of women among top-billed actors. Let’s start with some exploratory data analysis. Here are the top ten highest-grossing Hollywood movies according to the data.
[1] "Avengers: Endgame" "Avatar"
[3] "Titanic" "Star Wars: The Force Awakens"
[5] "Avengers: Infinity War" "Jurassic World"
[7] "The Lion King" "The Avengers"
[9] "Furious 7" "Avengers: Age of Ultron"
Let’s see how this list compares to an inflation-adjusted list of highest grossing films.
[1] "Titanic" "Avatar"
[3] "Avengers: Endgame" "Star Wars: The Force Awakens"
[5] "E.T. the Extra-Terrestrial" "Avengers: Infinity War"
[7] "Jurassic Park" "Jurassic World"
[9] "The Avengers" "The Empire Strikes Back"
Adjusting for inflation vaults James Cameron to the top of the list with Titanic and Avatar. Next, I pull the longest and shortest movies from the data.
The Cure for Insomnia is an 87-hour long experimental film that consists of an artist reading a 4,080-page poem. It held the Guiness record for longest film before being supplanted by a non-American movie. Luxo Jr. is a two minute long animated film released by Pixar in 1986 that was the first CGI movie to be nominated for an Oscar. We can also look at which actors appear most in the data.
It turns out that Samuel L. Jackson is the hardest working actor in show business, with 76 top billings since 1980. Jackson has this distinction on lock, holding a nine-film lead on Unbreakable co-star Bruce Willis.
What other amusing outliers can we find in the data? How about worst movie of all time? I get this by filtering the data to movies that have received at least 40 Rotten Tomatoes reviews and sorting by average Rotten Tomatoes score.
These movies all received either a 0% or 1% on Rotten Tomatoes based on 40 or more reviews. There are some derivative horror movies (One Missed Call, Alone in the Dark) and tasteless comedies (Disaster Movie, National Lampoon’s Gold Diggers) here. We see movies that have ended careers (Roberto Benini as Pinocchio in Pinocchio, Cubo Gooding Jr. in Daddy Day Camp). My favorite on this list is Dana Carvey’s incredibly misguided attempt to capitalize on the success of Michael Myer’s Austin Powers with The Master of Disguise.
Actors’ Critical and Commercial Success
Next, I look at how actors compare in terms of the profitability and critical success of their films. The figure below was created using the Highcharts Javascript library. It shows actors who have starred in more than 20 movies since 1980. The x-axis is the average Rotten Tomatoes score of an actor’s movies, and the y-axis is average profitability, measured as net box office returns adjusted for inflation. The actors are in three groups. Red dots represent actors that have never been nominated for an Oscar, silver dots are actors that have been nominated but have never won an oscar, and gold dots are actors that have won an oscar. Being in the upper right part of the figure is good, while being in the lower left part of the figure, is bad. You can hover your mouse over each dot to view the stats on that actor.
The figure shows a positive correlation between critical acclaim and box office returns. The data is heteroskedastic: the spread in box office returns increases as the mean Rotten Tomatoes score goes up. There’s a positive relationship between winning an Academy Award and being in positively reviewed and profitable movies. To see this clearly, click the “Nominee” label at the bottom of the figure to hide nominated actors and display only actors that have won an oscars and actors who have not been nominated.
Some actors have carved out a niche as “prestige” actors - while their movies may not make a lot of money, they are able to continue to get work on the critical acclaim that their movies receive. These actors can be found in the lower right-hand corner of the figure. They include Phillip Seymour Hoffman (the most critically-acclaimed actor in the sample), Frances McDormand, Edward Nortan, Denzel Washington, Jack Nicolson, and Angelica Houston. The lower-left quadrant of the figure, on the other hand, has actors whose movies do not garner praise from critics or make a lot of money. Unsurprisingly, most of these actors are no longer in large-budget Hollywood films. They include Brendan Fraser, Sharon Stone, Kevin Pollack, Cuba Gooding Jr., and John Travolta.
One could conclude from this figure that Alan Rickman is the greatest actor of all time. He appears at the top right of the plot. His combined Rotten Tomatoes score and mean box office returns are significantly higher than any other actor’s. Shockingly, Rickman was never nominated for an Academy Award. Fittingly, the Guardian gave Rickman an “honorable mention” on their list of greatest actors to never have been nominated for an oscar.
Box Office Returns by Genre
The next figure shows trends in the kinds of movies that do well at the box office. Each point represents a movie, the x-axis gives the date of a movie’s release, and the y-axis indicates gross box office returns. Movies are grouped into six genres - Action, Adventure/Fantasy, Drama, Comedy, Animated, and Horror. You can hover over a point to view the details for a specific movie. To filter by genre, click the genre label at the bottom of the figure.
Movie box office returns vary substantially by genre. The movies that make the most money are Fantasy/Adventure movies such as superhero franchises. The number of highly profitable Fantasy/Adventure films has increased in the past fifteen years or so. This can be seen clearly by removing the other genres from the plot. Animated movies have also had an uptick in profitability. This started with the release of Toy Story in late 1995.
At the other end of the profitability spectrum are horror films. Represented by red dots, these movies sit along the bottom of the figure. Horror movies are often made on very small budgets, and rarely make a lot of money. The most profitable horror movie in this figure is The Sixth Sense, with an adjusted net box office of almost $1 billion.
We can look at the bottom of the figure to see the biggest box office bombs in since 1980. There are many - Gigli, Adventures of Pluto Nash, Inchon, Mars Needs Moms - but the standout among them is Cutthroat Island, a 1995 comedy with an adjusted net box office of negative $143 million. Sure enough, this movie holds the Guiness record for largest box office loss of all time. The movie bankrupted its production company, Carolco Pictures, which went under the same year the movie was released.
Actor Representation by Race/Ethnicity
Turning to demographic trends, the figure below visualizes changes in the average proportions of white, Black, Hispanic, and Asian top-billed actors in all Hollywood movies since 1980. Unlike the previous figures, this one allows you to “drill down” to additional figures by clicking the lines of the main plot. The drill down plots were written in Javascript and are incorporated into the code for the main plot using the JS function from the htmlwidgets package.
The racial makeup of actors in top-billed Hollywood roles has not changed much since 1980. Still, we do see a meaningful increase in the representation of Black actors. The proportion of black actors has increased from .033 in 1980 to .146 today. Conversely, white actors went from filling about 95% of the top movie roles in 1980 to filling 79% of these roles in 2019. We see small changes in the percentages of top-billed Asian and Hispanic actors, both of which went from under 1% in 1980 to 3-3.5% today.
Click on the line representing Black actors to see the breakdown of top-billed Black actors by genre. This area chart shows that top-billed Black actors were cast almost exclusively in comedies and dramas in 1980. The increase in the overall proportion of Black actors among top-billed actors appears to have resulted from greater black representation in the other genres. In particular, more black actors star in animated movies and in fantasy/adventure movies today.
Actor Representation by Gender
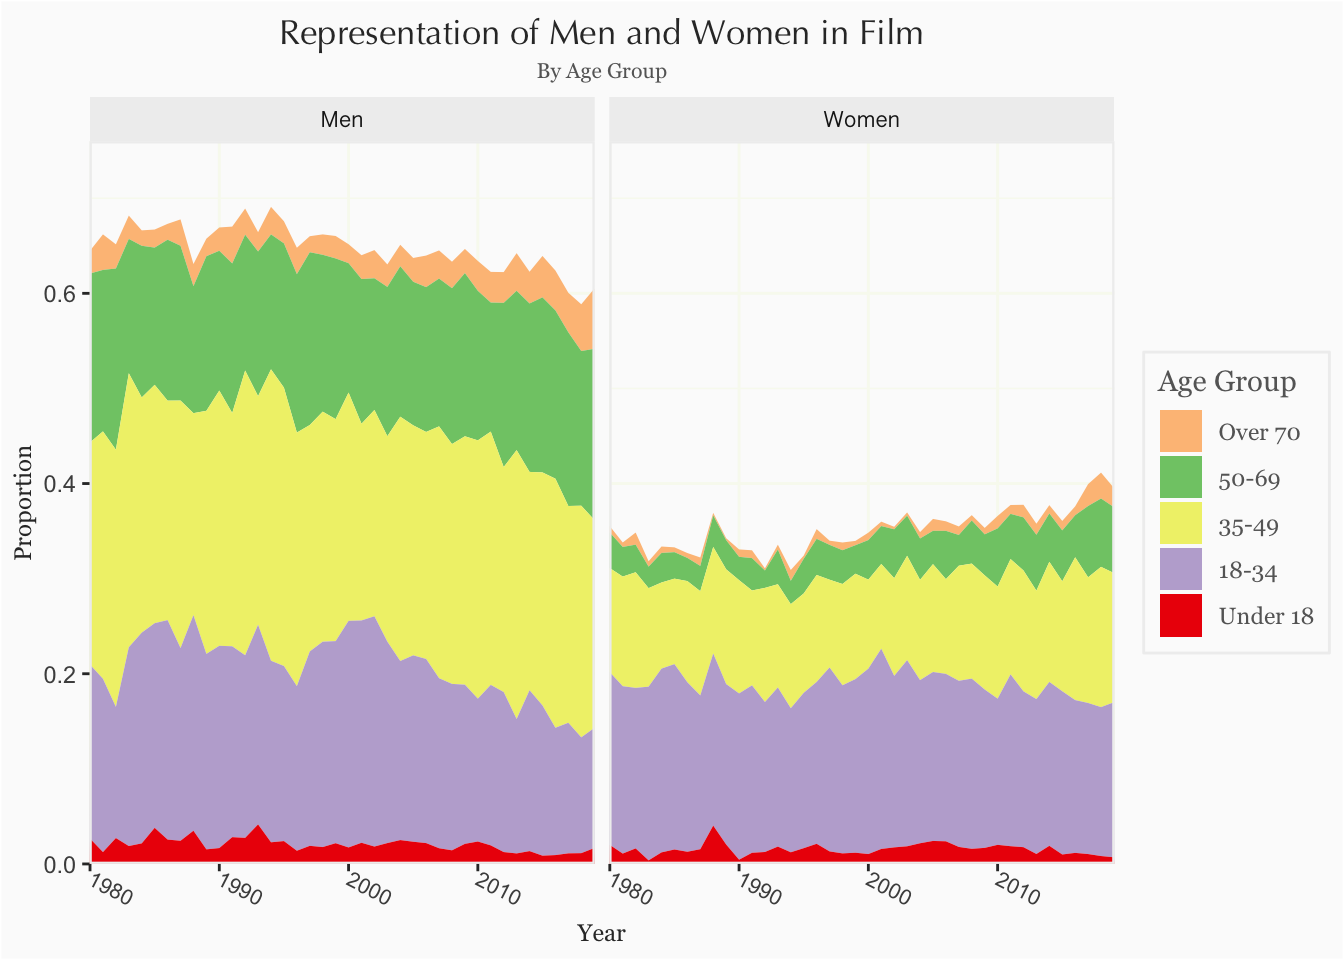
What about the relative representation of men and women in Hollywood? Overall proportions of men and women have not changed a whole lot (it’s about 60-40). We see some interesting trends when we disaggregate the genders by age group. The following figure displays changes in proportions of men and women in Hollywood movies by age groups. Men are in the left plot and women are in the right plot. Each plot divides men and women into five age groups: under 18, 18-34, 35-49, 50-69, over 70.
Look at the age breakdown of women in the left plot. The red, purple, and yellow layers represent women actors 49 and under. Even today, these groups make up about 80% of top-billed women actors. Older women remain highly underrepresented in Hollywood film. There’s also a large discrepancy in representation between older women and older men, who appear to be about 4 times more prevalent than older women. This can be seen by comparing the green layers of the two plots.
That concludes our journey through forty years of Hollywood film. I hope you learned a thing or two. Please reach out to me if you have any questions about how I created these plots or the underlying data.